Case Study: The Need for Accurate Fuel Consumption Data
June 26, 2020
This is the first part in a series about fuel conservation. To read the second post in this series on Locomotive Idle Reduction, click here. To read the third post, Optimizing Locomotive Energy Management Systems (EMS), click here.
INTRODUCTION
Class I railroads in North America consumed over 4 billion gallons of fuel in 2019. Fuel conservation and GHG emissions reduction is always a priority as railroads continue to focus on moving freight more efficiently, burning less fuel, and reducing emissions.
Accurate on-board locomotive fuel consumption data isn’t just nice to have, it is indeed as the Brothers Grimm story indicates – the required fuel data straw that Rumpelstiltskin turned into fuel savings gold. There are a wide variety of ways to conserve diesel fuel – training, the use of technology such as Energy Management Systems, and operational changes such as reducing the horsepower per trailing ton used to pull freight. All of these methods require accurate fuel burn data and a comprehensive methodology to analyze and calculate specific ROI’s for the literally dozens of ways to approach saving fuel.
This blog post will outline the accuracy required for on-board locomotive fuel data and a tried and proven methodology required to determine the level of fuel savings for any given initiative as it progresses from a field test phase to a potential full blown implementation, assuming the ROI is attractive once all other aspects of the operations are taken into account.
VARIABILITY DISCUSSION
Let us begin with a brief conversation on variability. Common measures of variability in statistics include range, inter-quartile range (IQR), variance, and standard deviation. Without making this blog post a statistical treatise, you generally want variability to be as small as possible. In a manufacturing world, variability has to be very low or piece parts wouldn’t fit together and function as designed or intended. In the real world of railroading, fuel burn variability is (unfortunately) quite high. There are a lot of reasons for this, and not many are within our ability to control.
Variability Drivers
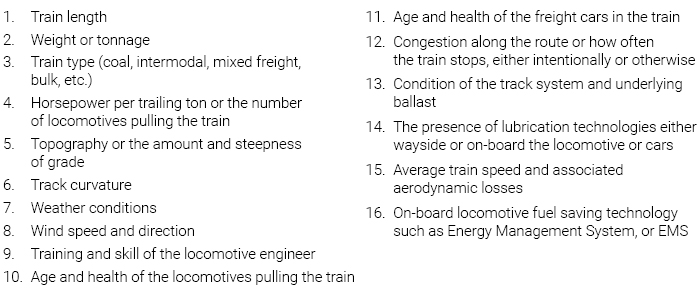
The above list is by no means a comprehensive or complete list of what drives excessive variability in railroad fuel consumption – but we’ve hit all the major high points. Due to the large number of variability drivers, it is not uncommon for what is considered the “same” train to burn significantly less or significantly more fuel than the average for that train type and location – 40% higher or lower than the average amount are certainly possible under typical operating conditions.
POWER AND SAMPLE SIZE
Now we’ll introduce another statistical concept, something called Power and Sample Size, as it relates to proving a statistical difference between two populations. In this case, let’s say we’re trying to assess a particular fuel savings technology that promises a 3% fuel savings. We’d like to be at least 95% confident that there is indeed a 3% fuel savings, so we need to figure out what our sample size (the number of crew segment trips) with the technology operational will need to be.
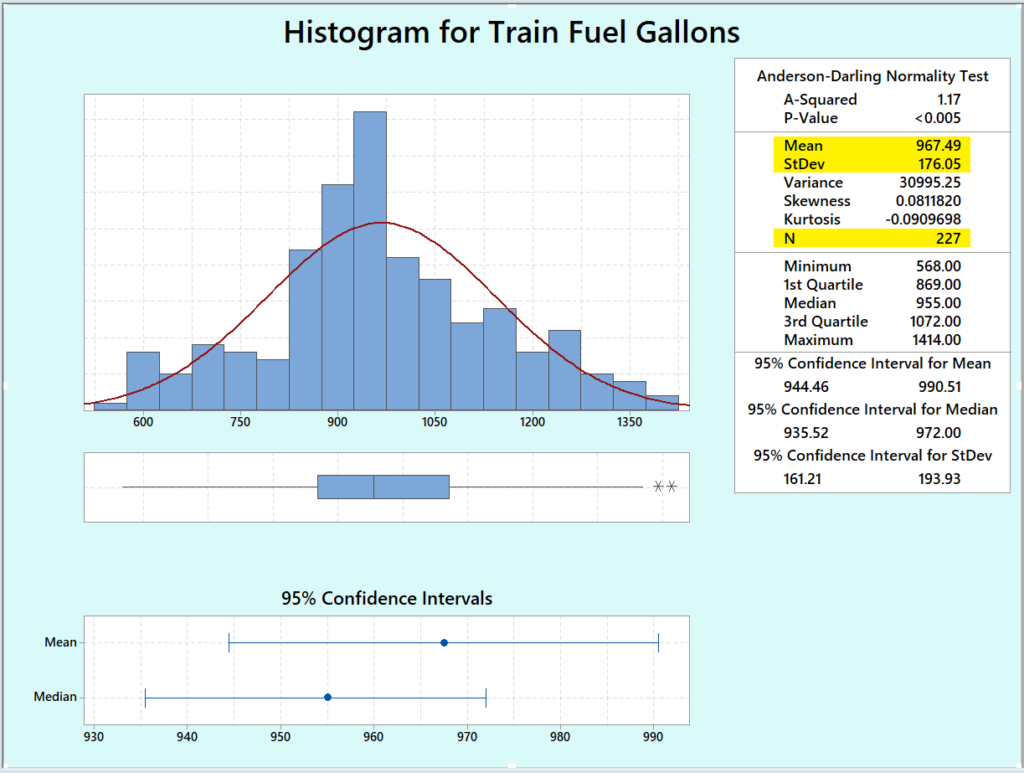
As an example, the chart to the left shows a normal distribution of 227 trip segments and an average or mean fuel burn of approximately 967 gallons. Notice the standard deviation (our measure of variability) is about 176 gallons rounded to the nearest integer. This is our baseline fuel consumption data with no technology applied or tested.
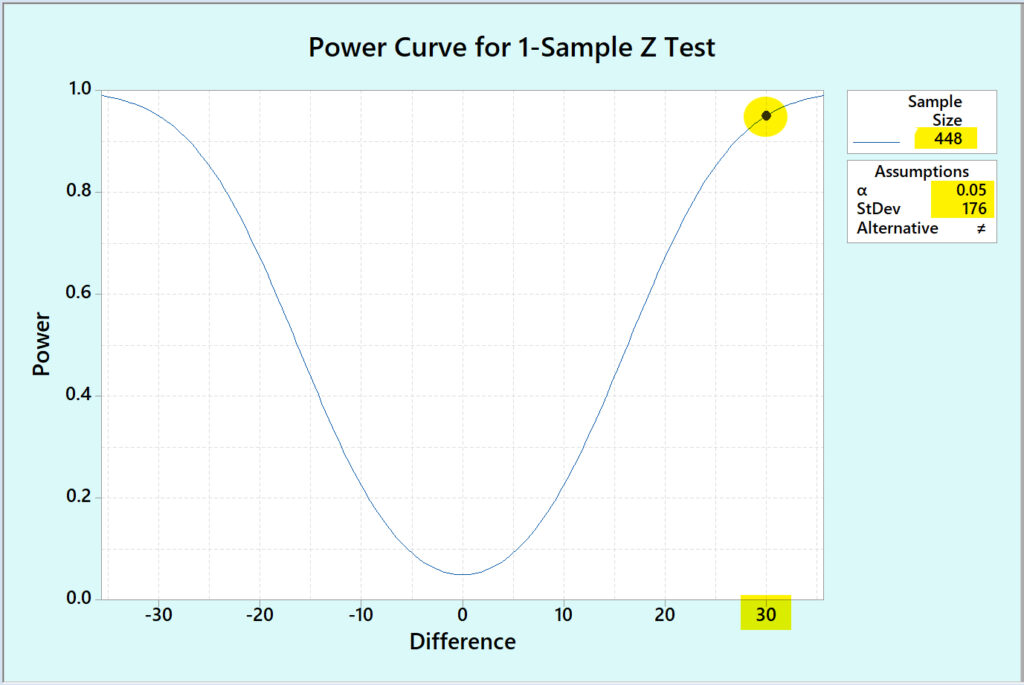
Now we run a Power and Sample size routine given we know what Power we want (95% confidence or 1 minus alpha or 0.05) and the standard deviation of our baseline sample data. The Power Curve shows that 448 crew trip segments will be needed to prove this technology looking for a 3% (approximately a 30 gallon) difference.
More accurate fuel measurement data will significantly decrease the standard deviation of your baseline data and thus reduce the required test crew segment trips needed to prove a given technology, operating change, or new training regimen.
CREW SEGMENT FUEL MEASUREMENT METHODOLOGY
Accurate fuel consumption data for each locomotive on a train is the crucial input needed to calculate fuel burn at a train level. Segmenting the data by crew segments (crew on to crew off) is the most convenient and useful methodology, given crew segment data can be used for many other purposes such as grading locomotive engineer performance and training initiatives or operational changes that may be geographically contained.
Back to our discussion on sources of variability, there are some sources that can and should be accounted for and which determine how data is gathered, compiled, and segmented to be used for future fuel analysis of any kind. There are a few discrete measures that need to be addressed, such as:
- Number of locomotives pulling the train (this assumes there may be some locomotives shutdown or idling)
- Type of train (coal, intermodal, mixed freight, bulk, etc…)
- Geographic location, or crew point A to crew point B which must include direction as well
Now with this properly segmented crew trip fuel data, producing a fitted line plot or regression of the tonnage against the fuel consumption produces a graph such as shown below where each dot is a separate trip gathered over time for a specific train type with the same number of pulling locomotives traveling over the same crew segment in the same direction. As we would expect, the amount of fuel consumed increases as the tonnage and length of the train increases.
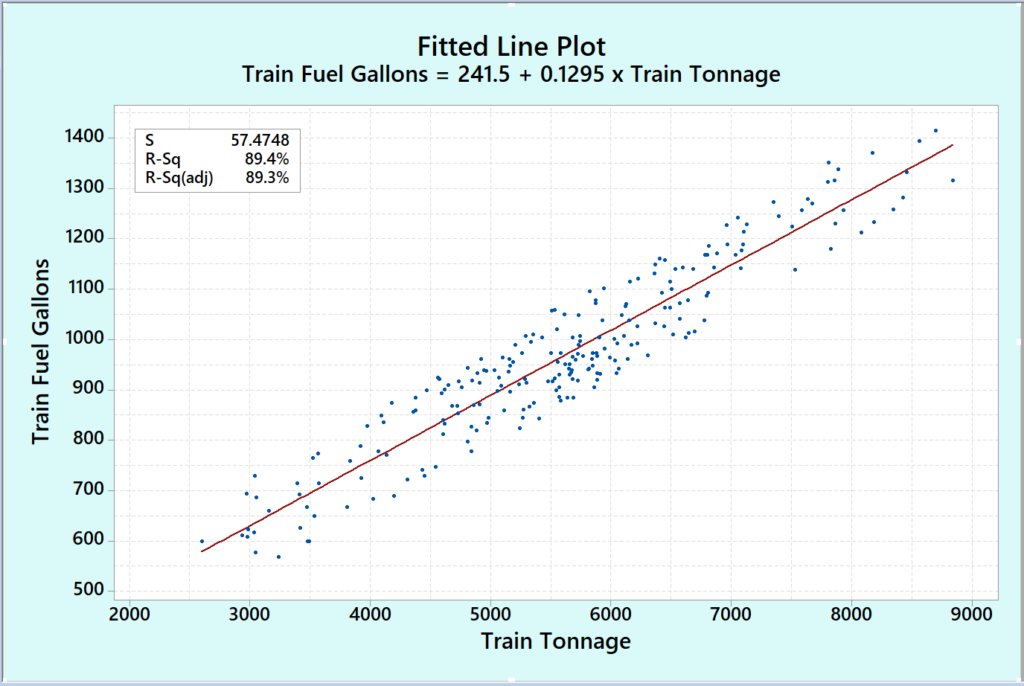
For a typical railroad operation, there would be several hundred, or even a few thousand, unique fitted line plots or regressions similar to the one above, which would account for the vast majority of their train operations. This then becomes the analytical comparison tool that is used to determine fuel savings for any given technology, training initiative, or operational change introduced.
Two regression lines would be plotted, one baseline crew trip data, the other crew trip test data and the average separation between the two fitted lines will determine the number of gallons saved for each individual location, and the associated percentage fuel savings across the total crew runs involved in the specific field test.
CONCLUSION
As you can see, a methodical and common sense approach to gathering and segmenting locomotive fuel data and then proving specific fuel savings for various fuel conservation initiatives does not need to be complex or cumbersome.
Even a question as simple as, “Do I really know which locomotives are actually pulling the train and burning fuel?” is not always easily answered unless reliable and dedicated fuel measurement technology is installed, properly maintained, and operating on virtually all high horsepower locomotives used to pull mainline freight.
As an example of what can happen with inaccurate fuel data, or not knowing with 100% certainty which locomotives are pulling the train and which ones are not – the fitted line plot below shows much more scatter in the fuel data which makes the ability to problem solve or determine exact fuel savings very difficult if not impossible.
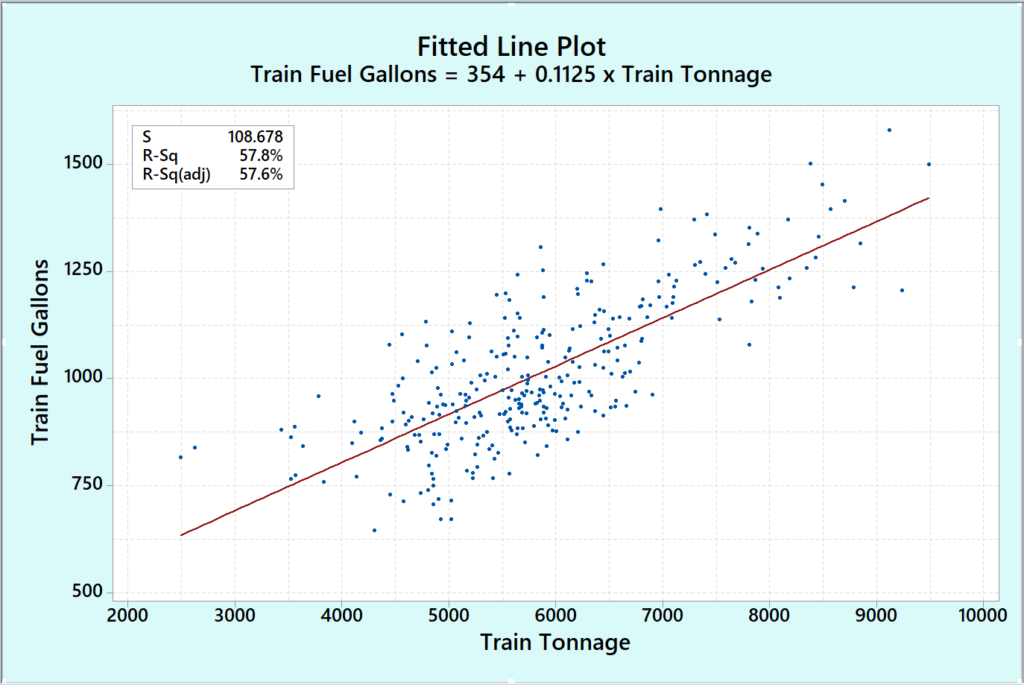
The more accurate the fuel data is, the fewer test trips will be required and the less time involved performing logistically complicated field tests to answer these critical questions of how much fuel is being saved and should this initiative progress from a field test stage to full implementation on a system-wide basis.
Having accurate on-board fuel data is absolutely essential to being able to make the proper business decisions when deciding to purchase new fuel savings technology, making trade-offs to operational changes, or justifying training expenses in terms of whether or not there is an adequate ROI to proceed.
Railroads that are able to answer these questions effectively stand a far greater probability of making significant gains in their fuel efficiency and emissions reduction in the long term. Truly, they will be able to, as Rumplestiltskin did, turn fuel data straw into fuel and emissions savings gold.